plot_him_matrix
Reliability status: stable
- calculates and plots matrices (PWD and proximity) from:
a file with single-cell PWD matrices in Numpy format
a file with the unique barcodes used
- Outputs:
Matrix (NxN) of mean pairwise distance, stored in a NPY file.
Visualization of this matrix in PNG format (or PDF/SVG)
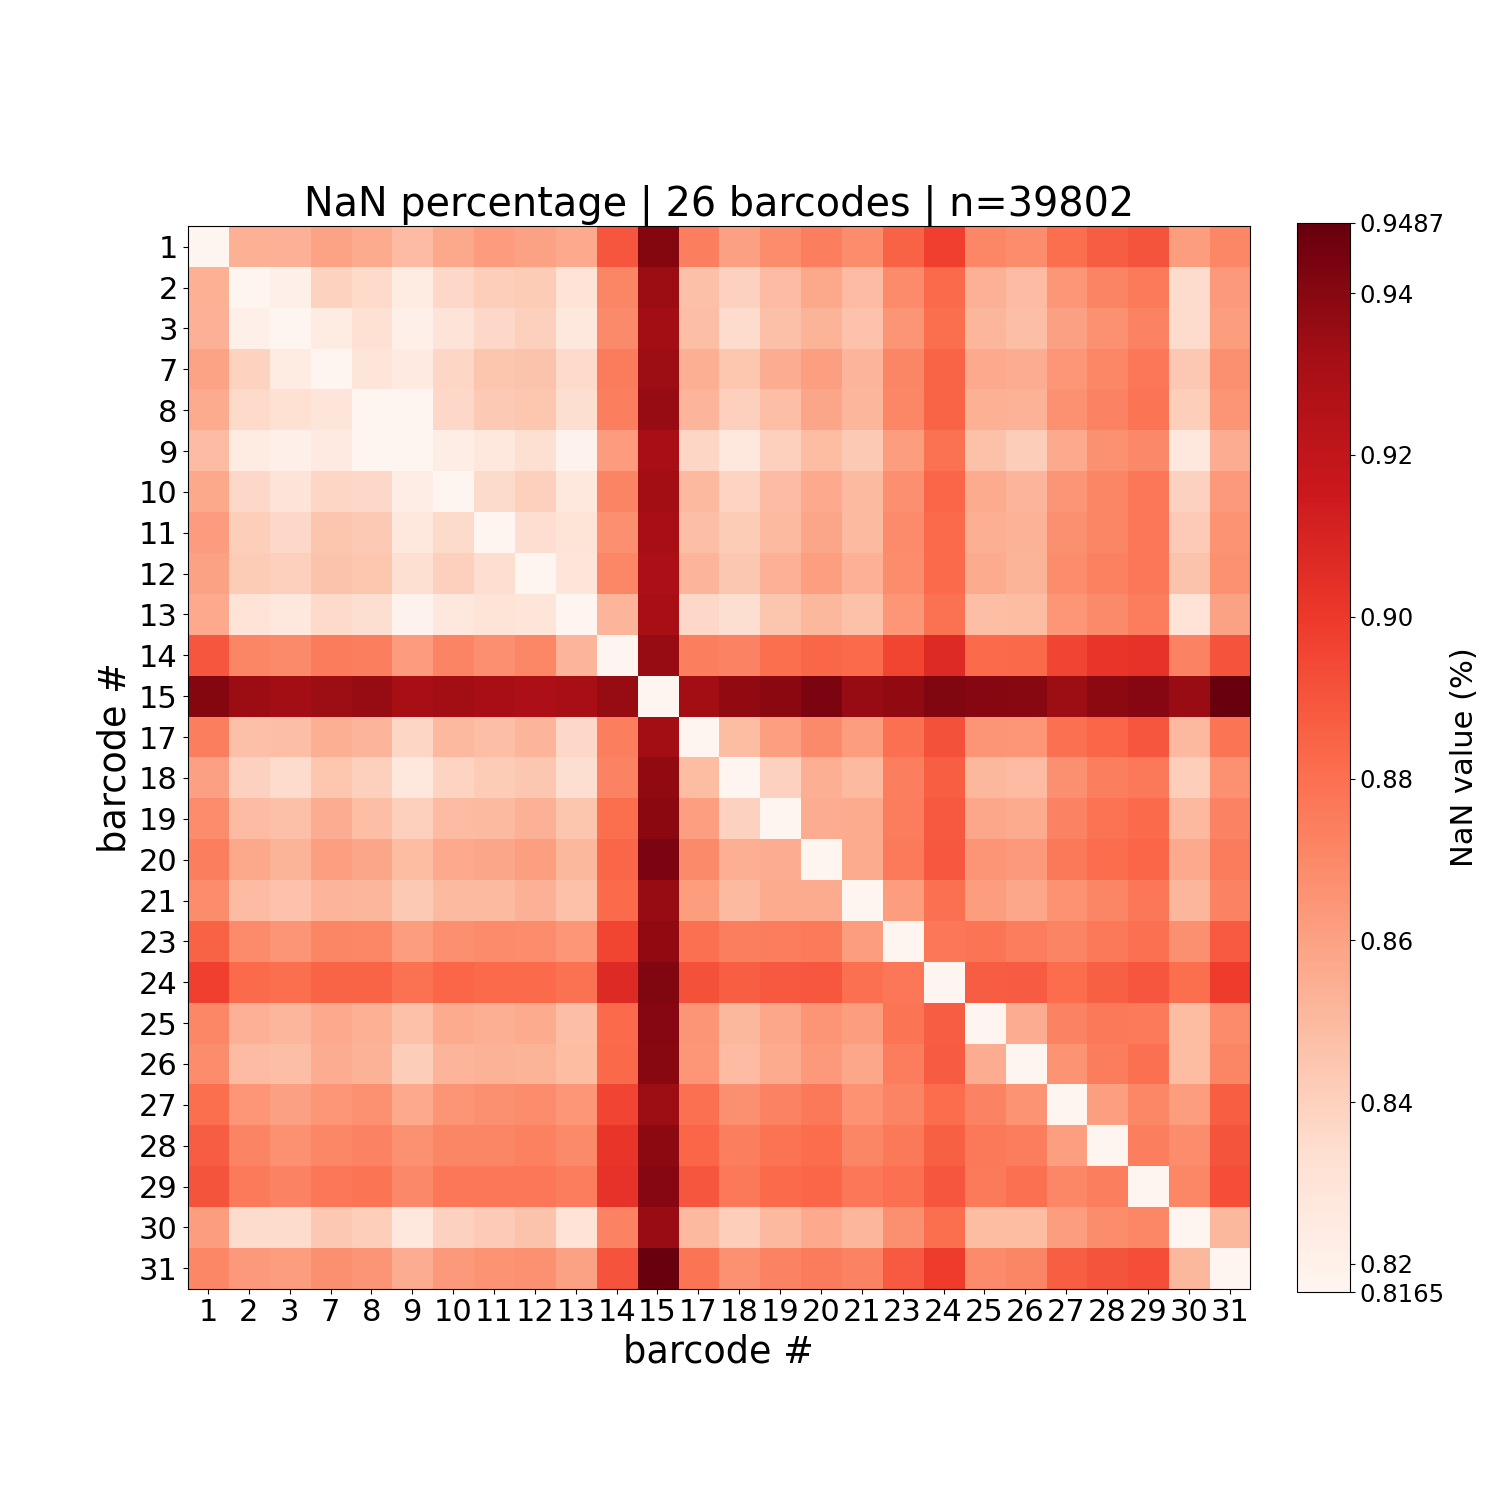
Shadow matrix of NaN (Numpy null value) percentage for each pairwise distance
usage: plot_him_matrix [-h] [-M MATRIX] [-B BARCODES] [-O OUTPUT]
                       [--output_format {png,svg,pdf}] [--shuffle SHUFFLE]
                       [--mode MODE] [--nan_threshold NAN_THRESHOLD]
                       [-T THRESHOLD] [-K MATRIX_NORM_MODE] [--c_min C_MIN]
                       [--c_max C_MAX] [--c_map C_MAP] [--fontsize FONTSIZE]
                       [--triangular] [--triangular_mode {upper,lower}]
Required arguments
These both arguments are required.
- -M, --matrix
Filename of single-cell PWD matrices in NPY format
- -B, --barcodes
csv file with a simple list of unique barcodes (int)
Advanced arguments
[Optional] Advanced args to personalize outputs
- -O, --output
Folder for outputs
Default:
'plots'- --output_format
Possible choices: png, svg, pdf
Output image format. Default = png.
Default:
'png'- --shuffle
Provide shuffle vector: 0,1,2,3… of the same size or smaller than the original matrix. No spaces! comma-separated!
- --mode
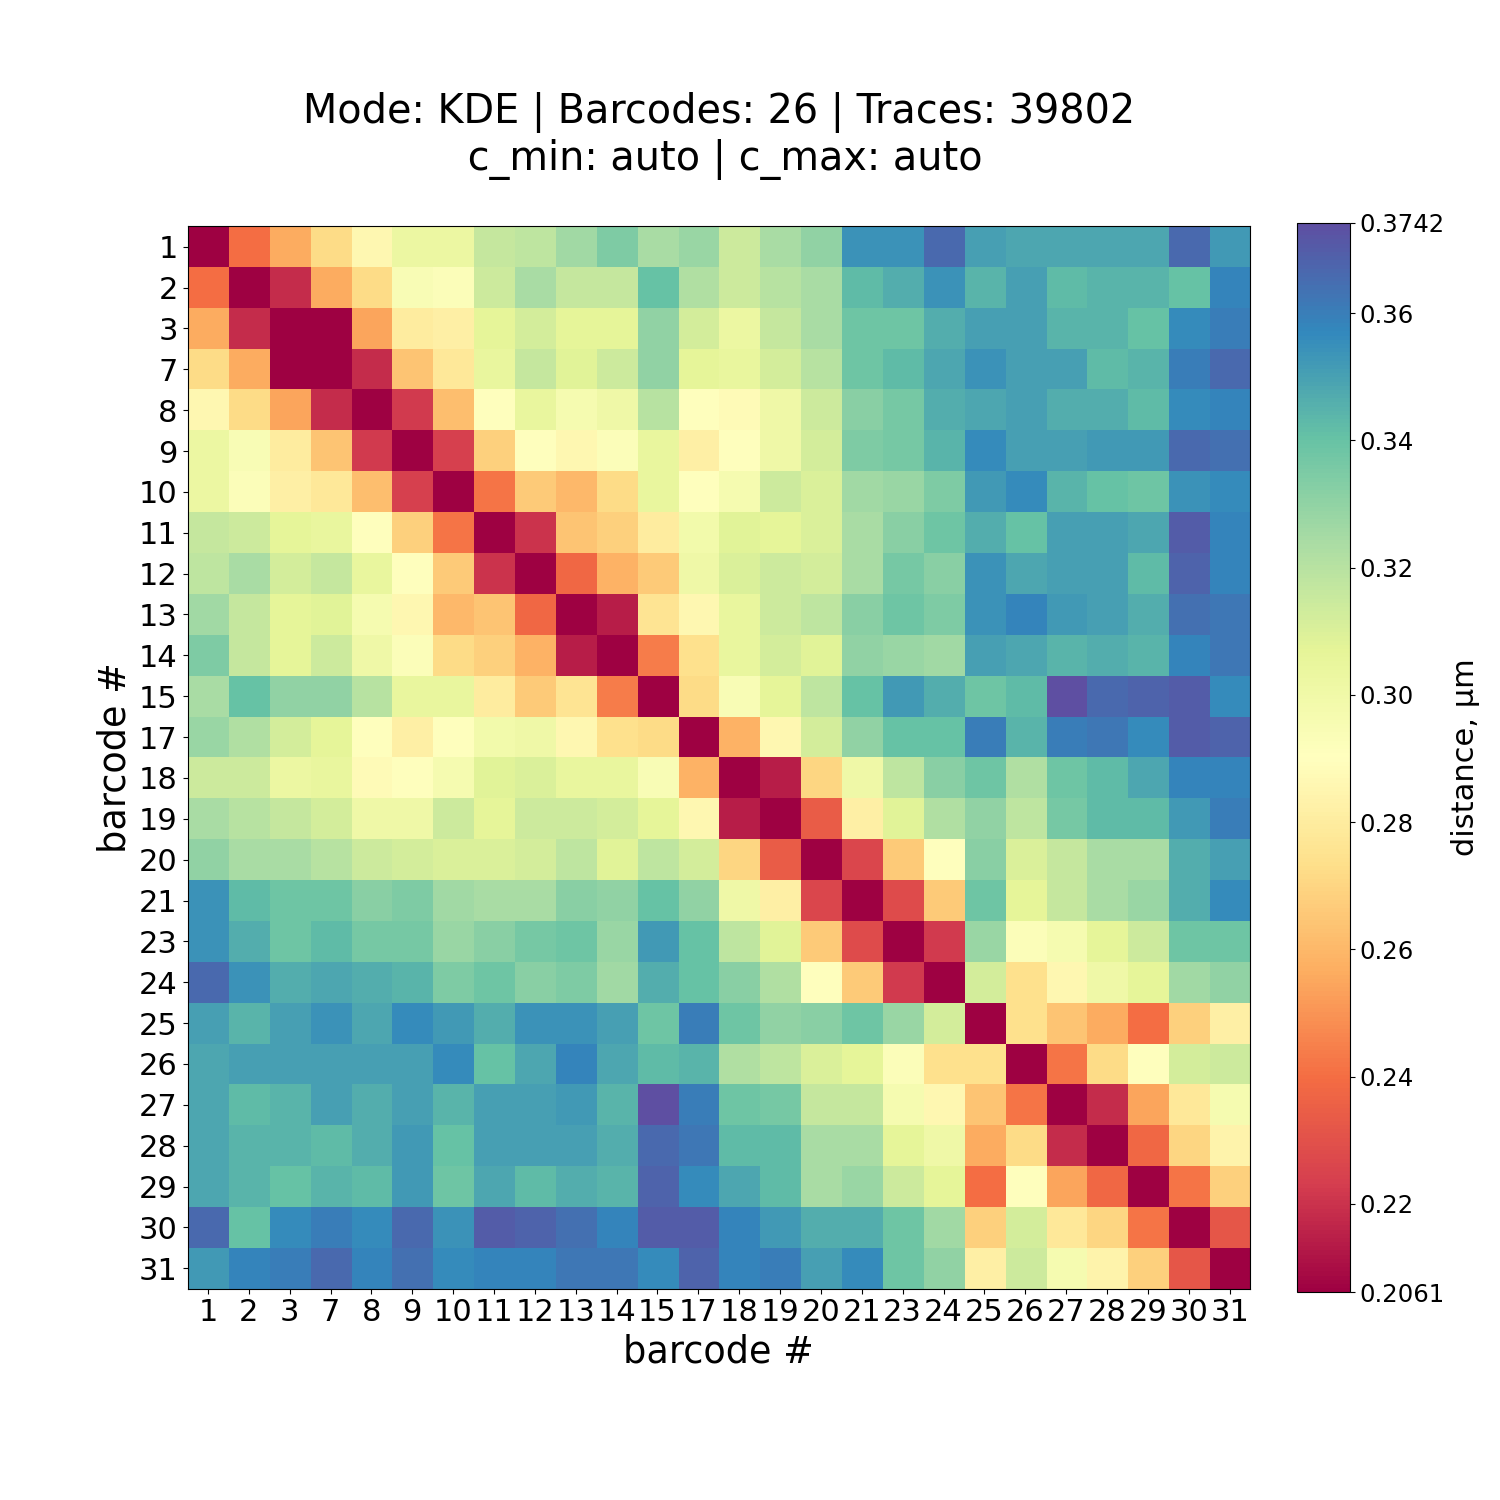
Mode used to calculate the mean distance. Can be either ‘median’, ‘KDE’ or ‘proximity’
Default:
'proximity'- --nan_threshold
Value between 0 and 1. Set a bin to NaN if: nan_percentage[bin] > nan_threshold
Proximity arguments
[Optional] Only for proximity `--mode`
- -T, --threshold
Proximity threshold in µm
Default:
0.25- -K, --matrix_norm_mode
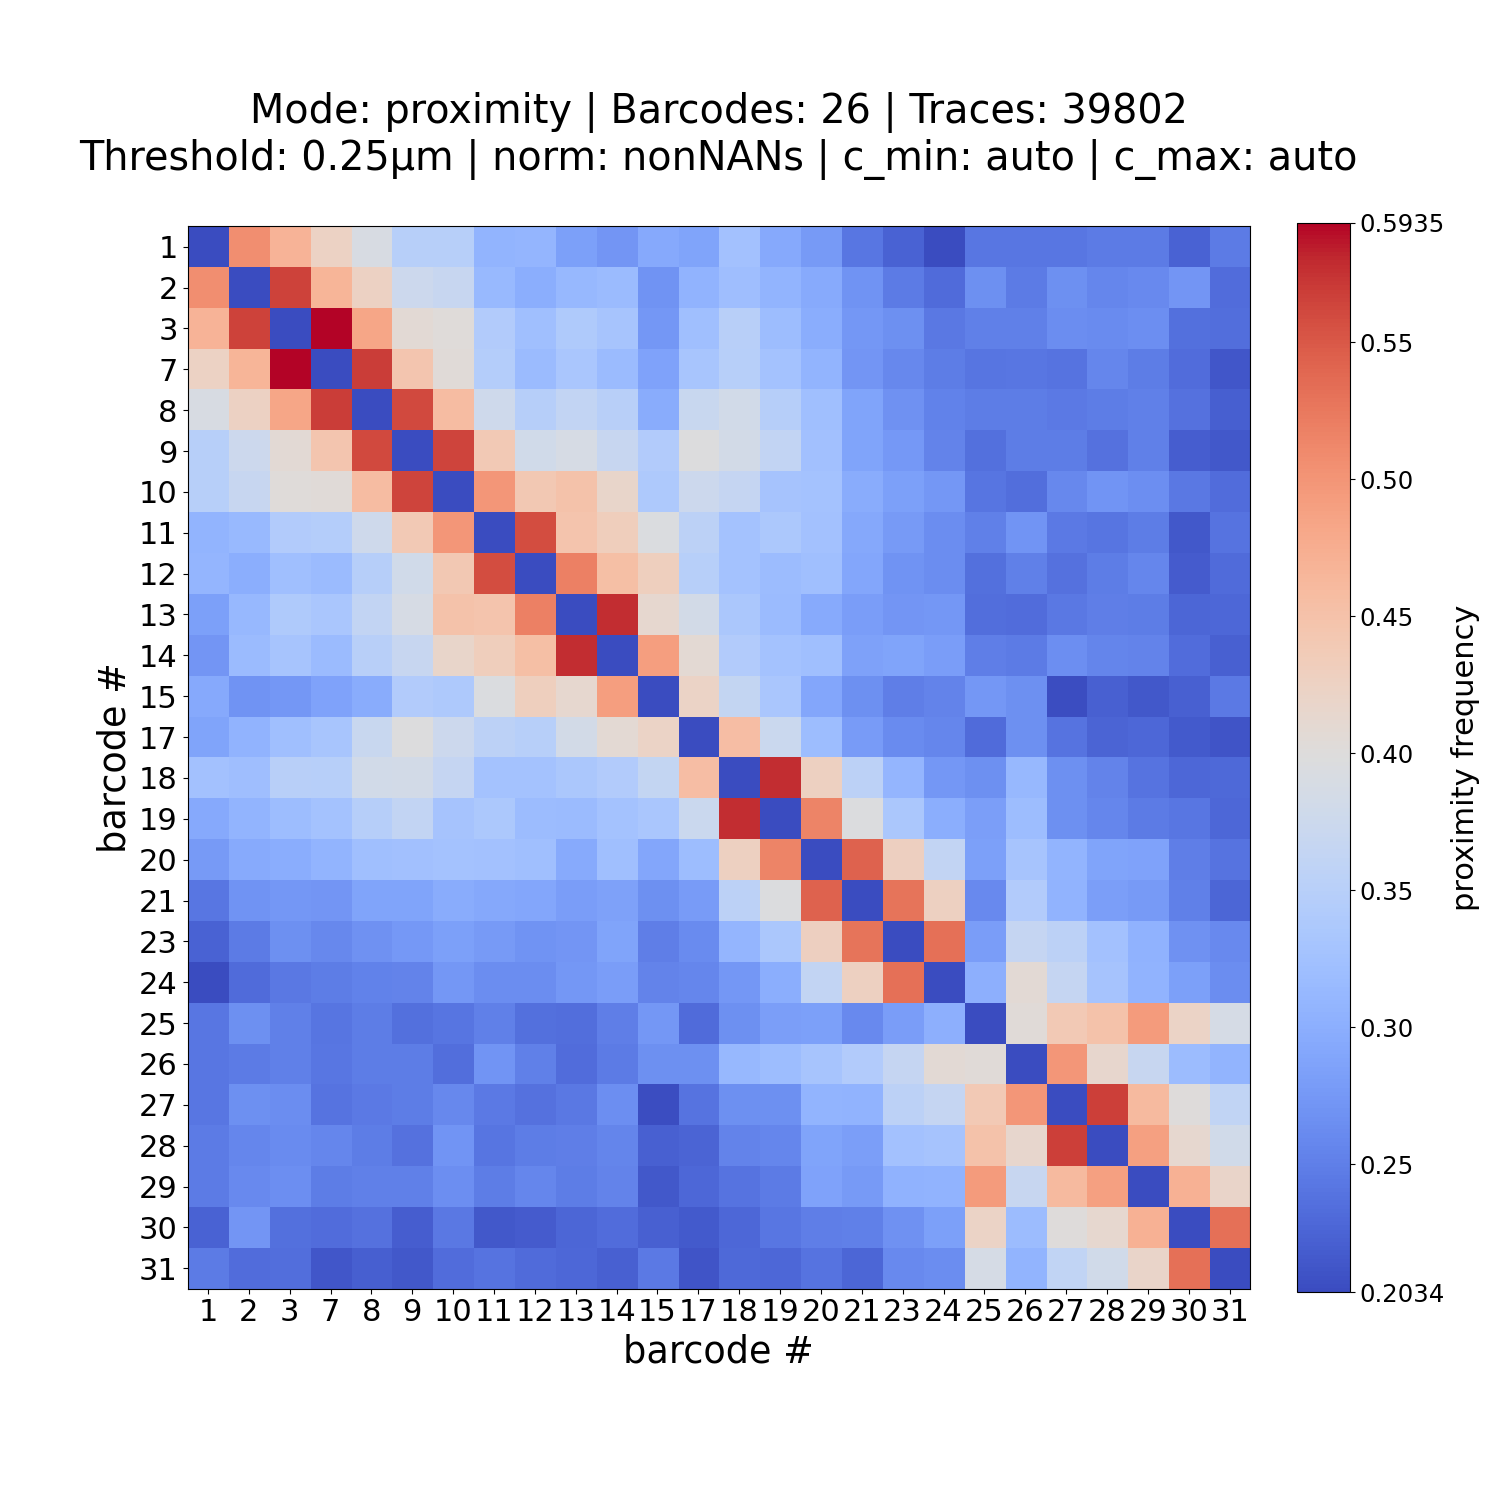
Matrix normalization mode. By default (‘nonNANs’), NaN values per bin are removed before compute statistics for proximity. Can be ‘n_cells’ or ‘nonNANs’.
Default:
'nonNANs'
Visualization arguments
[Optional] Custom visualization
- --c_min
Colormap min scale: automatic mode by default (detects the first frequency higher than 0)
Default:
-1.0- --c_max
Colormap max scale: automatic mode by default (detects the highest frequency value)
Default:
0.0- --c_map
Colormap (see: matplotlib > colormaps > diverging)
Default:
'coolwarm'- --fontsize
Size of fonts to be used in matrix
Default:
22- --triangular
Plot only upper triangle (useful for genomic coordinate visualization)
Default:
False- --triangular_mode
Possible choices: upper, lower
Which triangle to display (upper or lower)
Default:
'upper'
Output Files
The script generates:
[output]/Fig_[matrixfile]_[mode][_norm][_Tthreshold]_[c_min]-[c_max].[format]: Matrix visualization for the selected mode (proximity,median, orKDE). The_normcomponent is included when normalization removes NaN values, and_Tthresholdis included when a non-default proximity threshold is used.[output]/Fig_[matrixfile]_[mode][_norm][_Tthreshold]_[c_min]-[c_max].npy: NPY file containing the plotted matrix values.[output]/Fig_[matrixfile]_nan[_norm]_[c_min]-[c_max].[format]: NaN-percentage matrix plot. This file is written when--mode proximityis used.
Examples
Here is examples usage of plot_him_matrix:
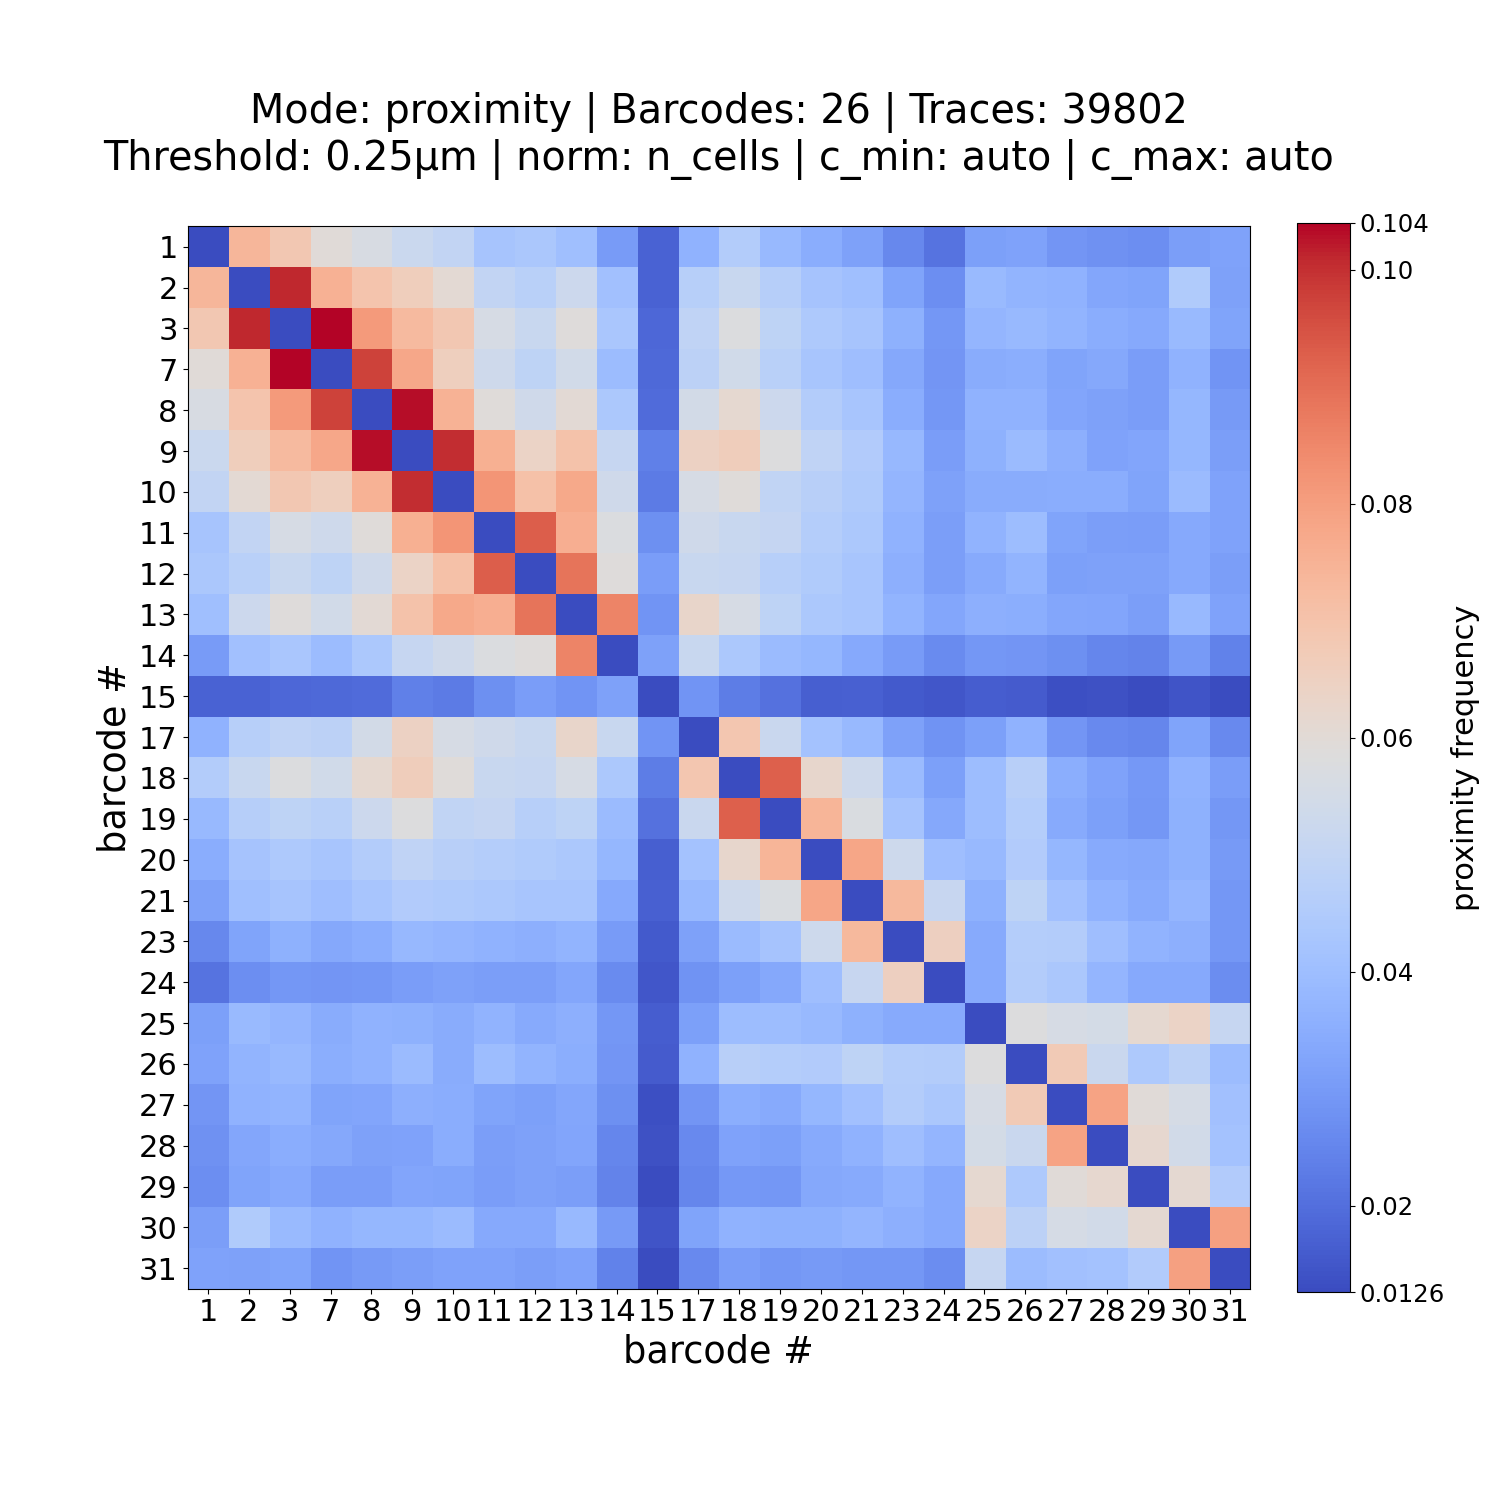
Proximity matrix with all data (including bin with NaN value)
plot_him_matrix -M PWDscMatrix.npy -B unique_barcodes.ecsv --matrix_norm_mode n_cells
Default normalized VS. KDE (c_map: Spectral)
plot_him_matrix -M PWDscMatrix.npy -B unique_barcodes.ecsv
VS.
plot_him_matrix -M PWDscMatrix.npy -B unique_barcodes.ecsv --mode KDE --c_map Spectral
Notes
See the command-line reference above for the complete option list.