trace_analyzer
Reliability status: development
Read a trace table and derive several different analysis, including the distribution of number barcodes per trace: total, duplicated, and non-duplicated. It also exports the Rg distribution.
Analyze chromatin trace files.
usage: trace_analyzer [-h] [-F ROOTFOLDER] [--input INPUT] [--plotXYZ]
                      [--pipe] [--output_format {png,svg,pdf}]
                      [--neighbor_distance_range NEIGHBOR_DISTANCE_RANGE]
Named Arguments
- -F, --rootFolder
Folder with images
Default:
'.'- --input
Name of input trace file.
- --plotXYZ
Plots XYZ traces for all ROIs
Default:
False- --pipe
inputs Trace file list from stdin (pipe)
Default:
False- --output_format
Possible choices: png, svg, pdf
Output image format. Default = png.
Default:
'png'- --neighbor_distance_range
Hexbin axis range for previous-vs-next neighbor distance plots. Use ‘auto’ for automatic scaling or provide a positive maximum distance in µm. Default = 1, which plots 0 to 1 µm.
Default:
'1'
Description
A Python script for analyzing chromatin trace files. The script loads trace files and generates statistical analysis and visualizations of various properties:
Number of barcodes detected per trace
Number of duplicated barcodes
Distribution of localizations in X, Y, Z coordinates
Distances between consecutive neighboring barcodes
Visual representations of traces
Barcode detection efficiency analysis with bootstrapped error estimates
Usage
# Analyze a single trace file
trace_analyzer --input path/to/your/trace_file.ecsv

# Analyze multiple trace files using pipe
find /path/to/traces -name "*.ecsv" | trace_analyzer --pipe

# Specify a different root folder
trace_analyzer --rootFolder /custom/data/folder --input trace_file.ecsv

# Generate SVG output instead of PNG
trace_analyzer --input trace_file.ecsv --format svg

# Generate XYZ plots in addition to statistics
trace_analyzer --input trace_file.ecsv --plotXYZ
Output Files
For each trace file analyzed, the script generates:
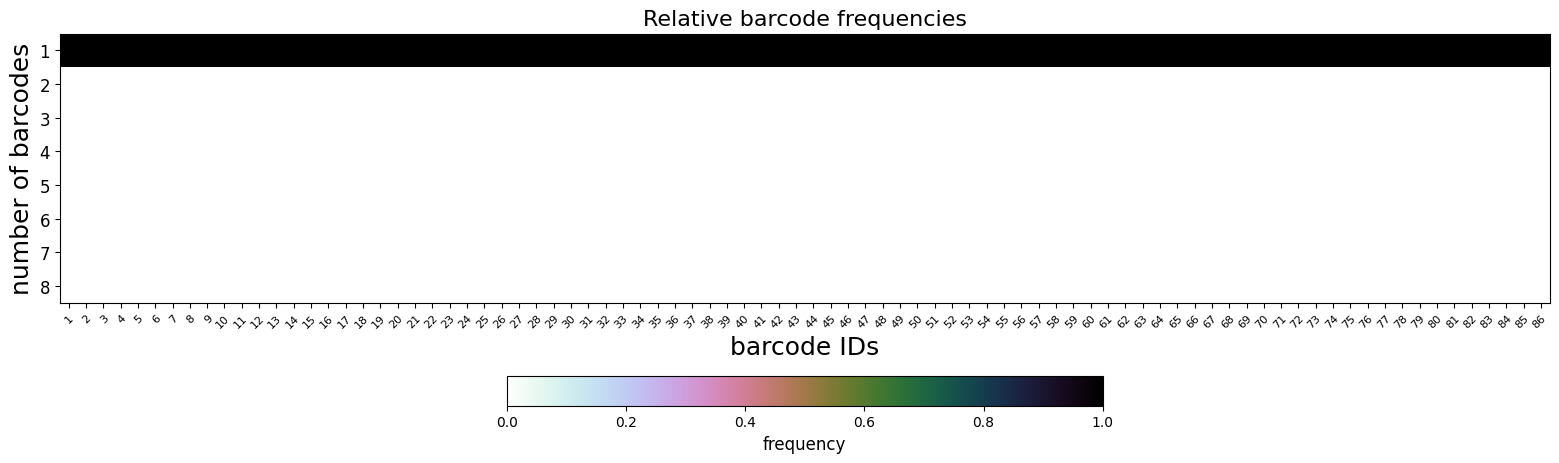
[tracefile]_relative_barcode_frequencies: Number of barcodes per trace, for each separate barcode. If only the top row is occupied, barcodes are present only once per trace. The second row represents the number of times barcodes are present twice in the trace, and so on.../../_static/merged_traces_relative_barcode_frequencies.png[tracefile]_barcode_detection.[format]: Plot of barcode detection efficiency. Errorbars are obtained by bootstrapping.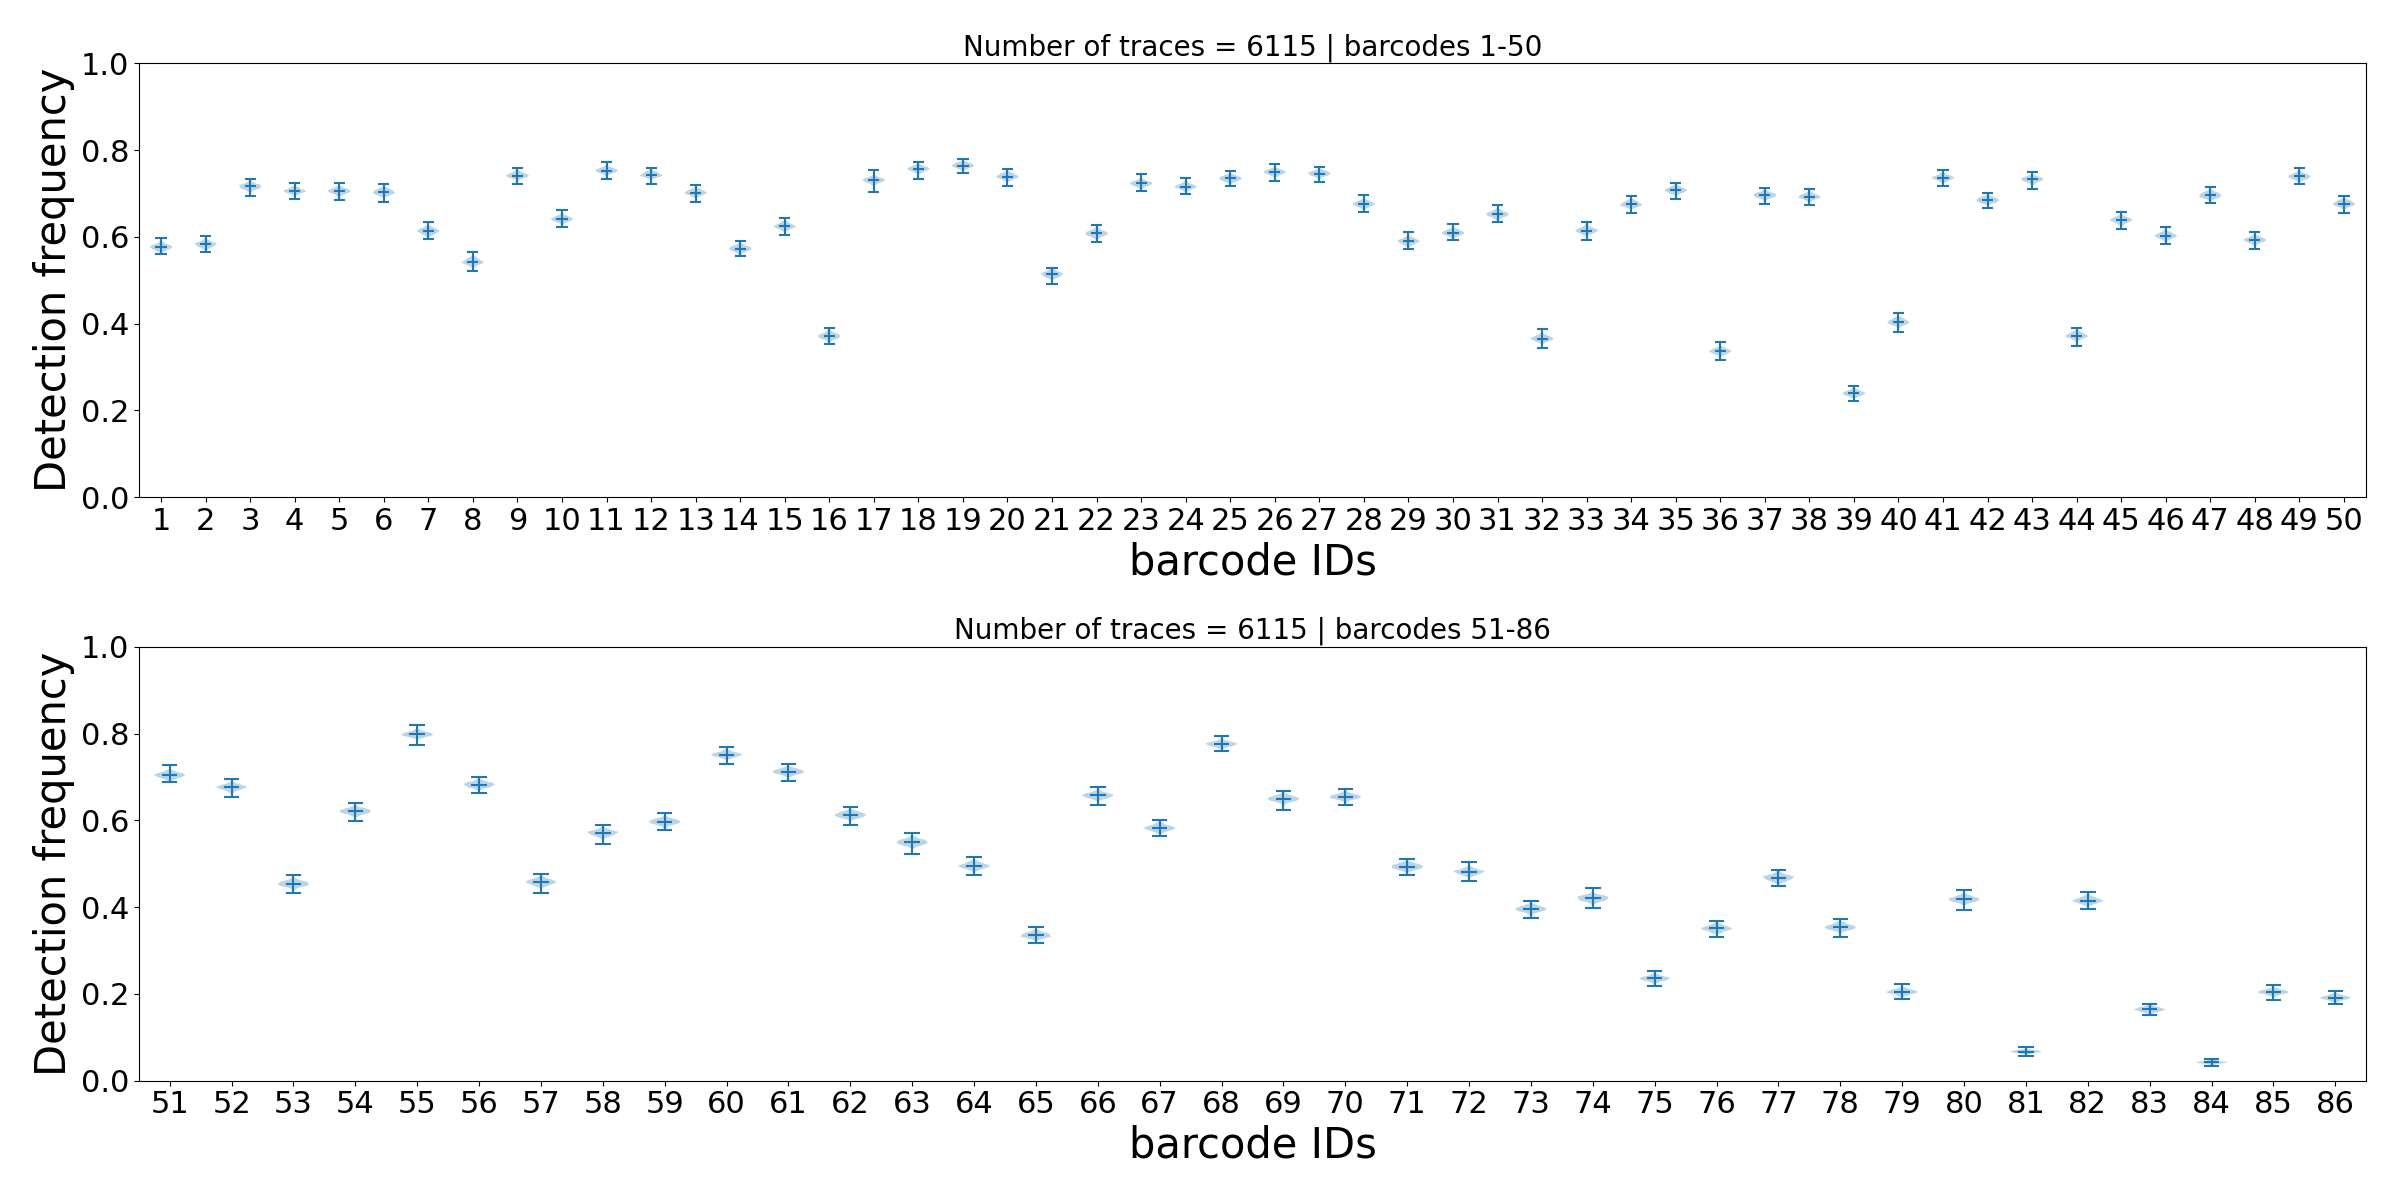
[tracefile]_trace_statistics.[format]: Histograms of number of barcodes per trace. !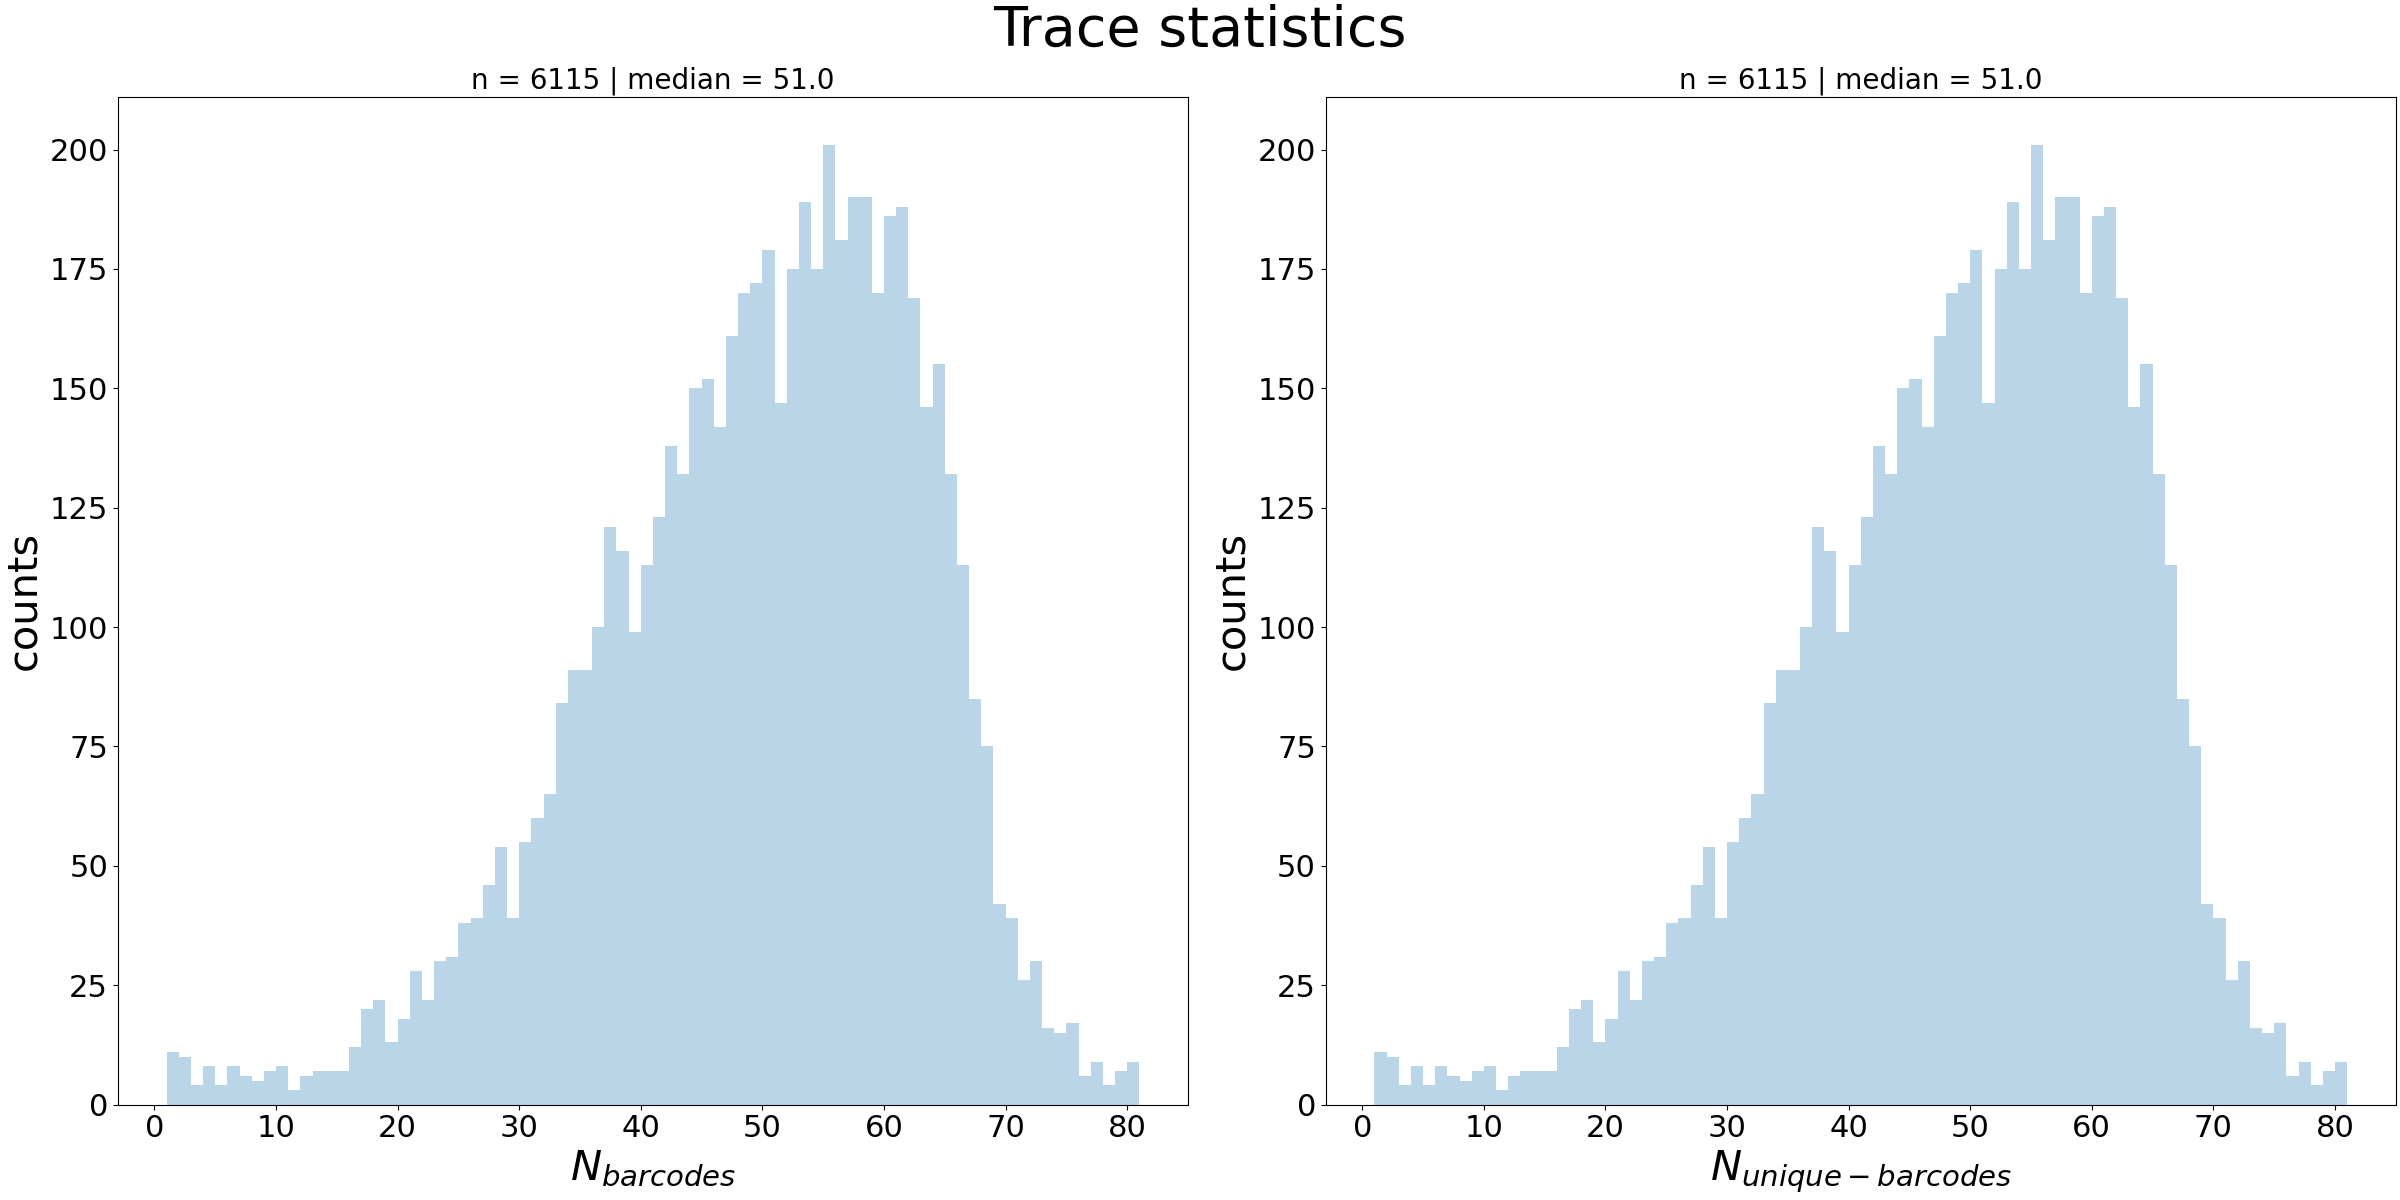
[tracefile]_kde_projections.[format]: Traces are translated to their center of mass and reprojected along XY, XZ and YZ.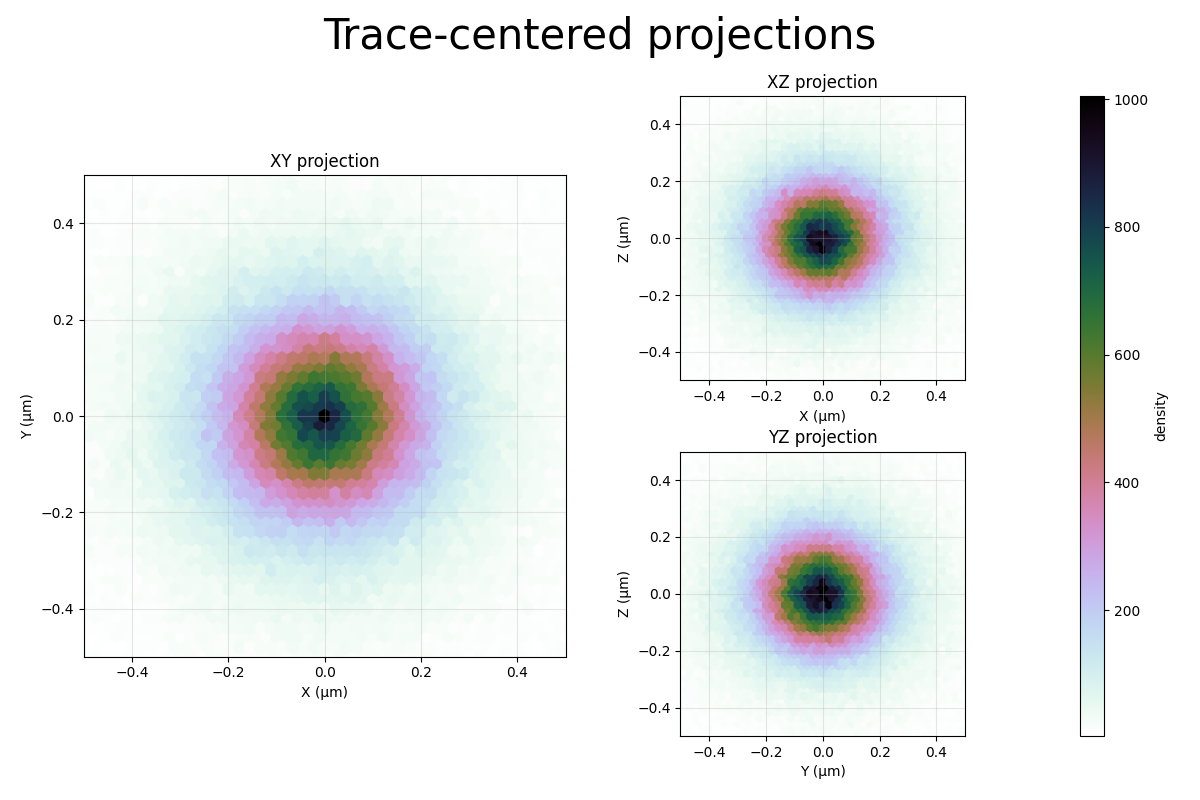
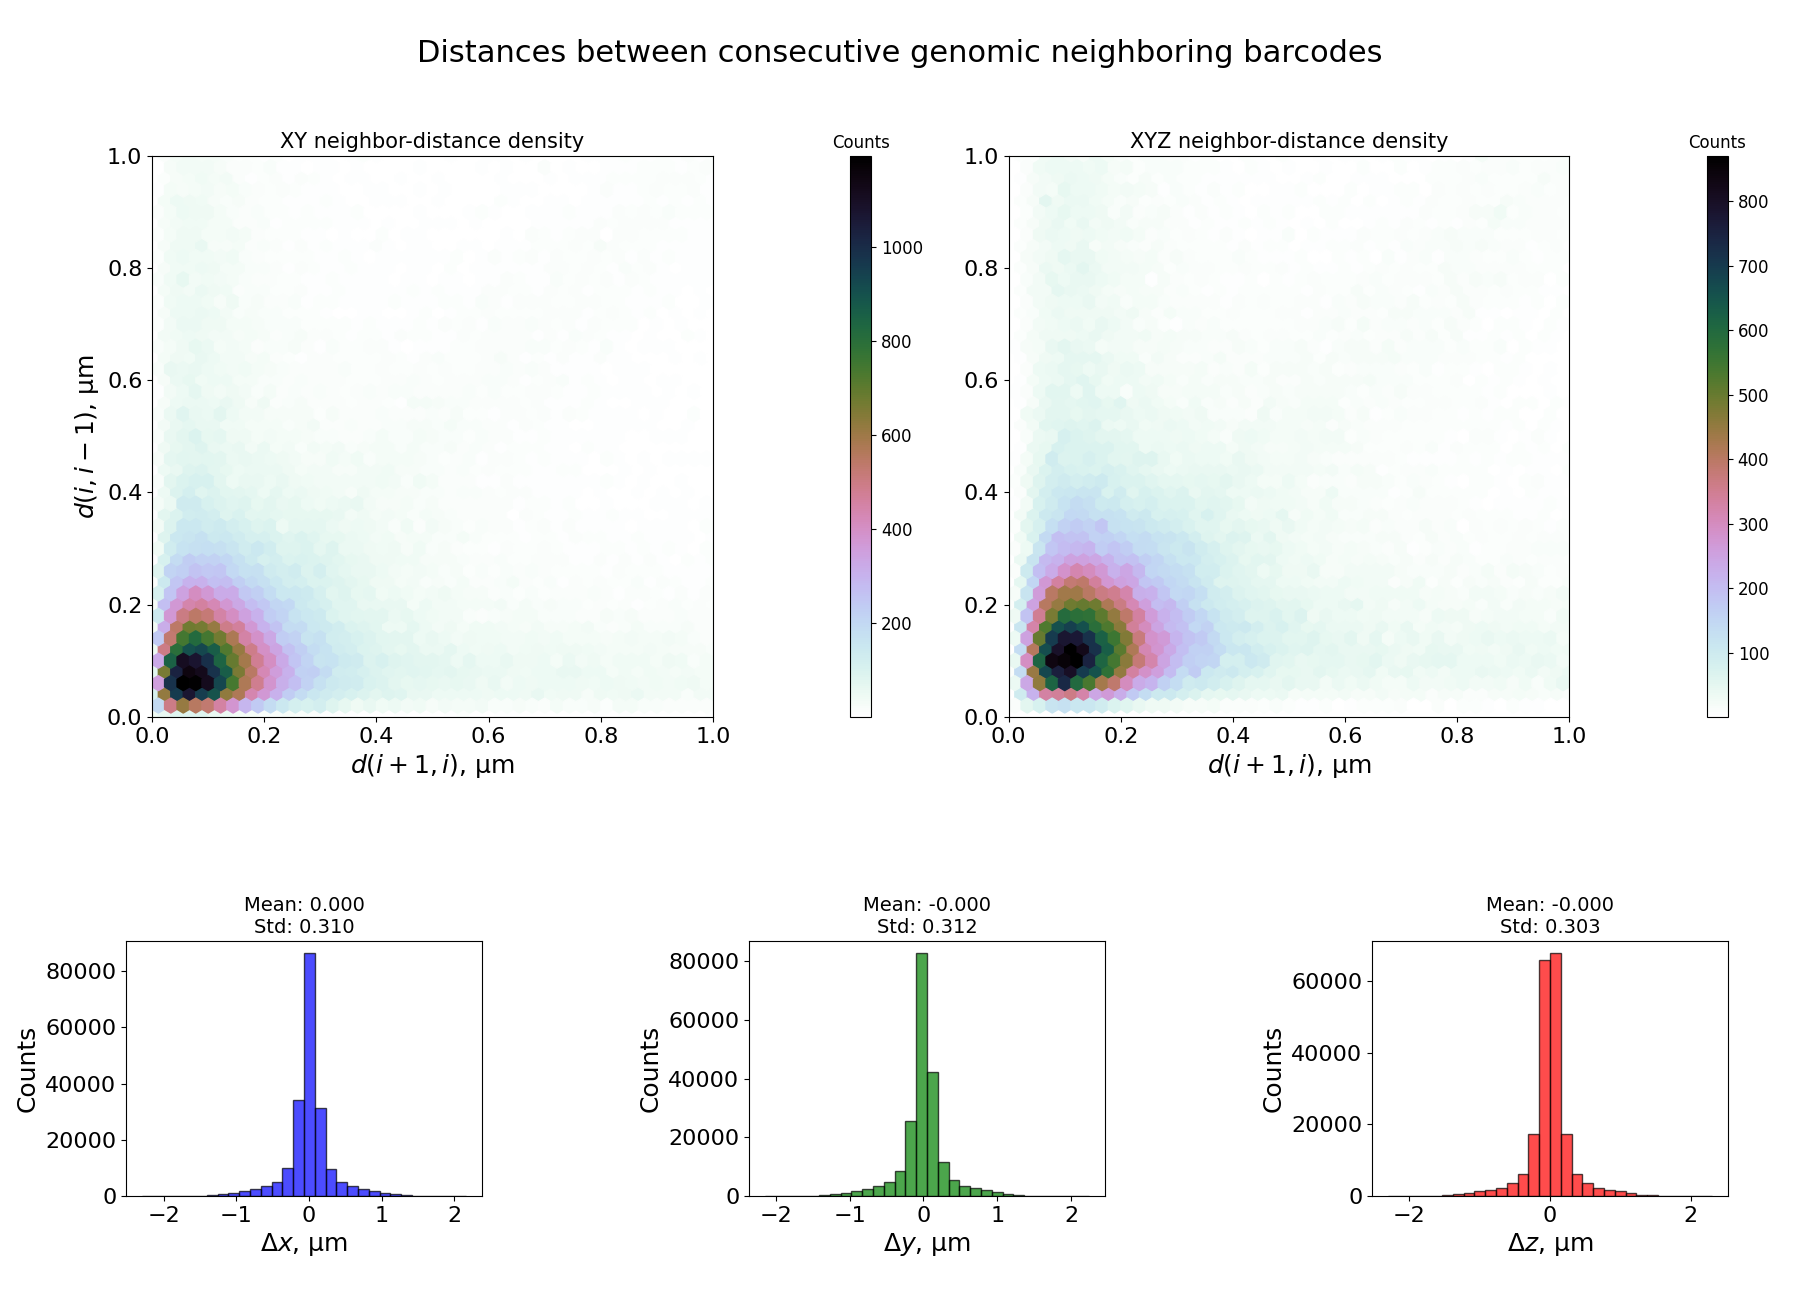
[tracefile]_first_neighbor_distances.[format]: Top plots represent the histogram of distances between next and previous neighbour for each barcode in the trace, for all traces, in XY and in XYZ. Bottom plots show histograms of distances between consecutive genomic barcodes in X, Y and Z.